An Internal Product for the Star Tribune
When I joined the Star Tribune as a Reynolds Journalism Institute Student Innovation Fellow, the news organization was in a period of digital transition. Leadership wanted the newsroom to focus on creating content and organizing workflows around its digital product. In order to accomplish that goal, the newsroom needed analytics to see how their work was performing.
Because of the way the Star Tribune’s website is designed, traditional analytics tools did not give the newsroom the full picture of the audience. To address that, we coded a Slackbot, called Striblytics, to generate analytics reports about story performance. Before we could begin writing the code, we needed to understand the core functionalities the newsroom might need in this project.
Empathizing with and getting buy-in from stakeholders
Since I was new to the Star Tribune and to Minnesota, I wanted to understand what reporters and editors valued at the organization and what information they felt they were lacking to do their jobs.
To get buy-in for the project, I hosted brown bag sessions, inviting the entire newsroom to provide feedback on our current analytics tools. These sessions were incredibly valuable, as I got to hear from a wide swath of reporters and editors about their jobs. These brown bags also helped explain the value of the tool for the newsroom.

While the brown bags were helpful to get feedback from a small group of reporters and editors, we also wanted data to understand how the broader newsroom felt about analytics and communicating in Slack. We conducted a survey to gauge their knowledge of the audience, analytics access and preferred methods of communication. This information helped prioritize the types of reports this bot would generate, the data included in the reports and the ways it would display analytics and notify users in Slack.
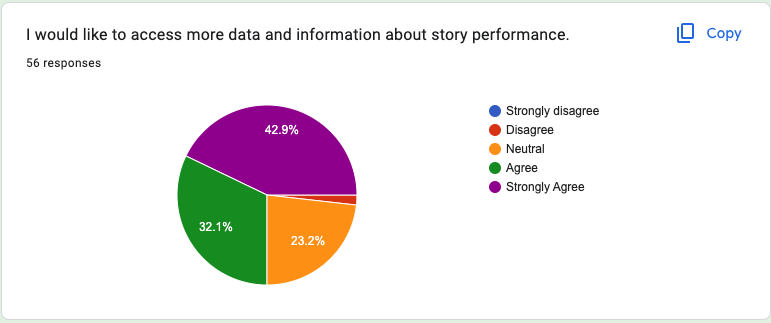
This survey gave us three pieces of valuable information. First, the newsroom is hungry for analytics. Over 75% of 56 survey respondents said they wanted more access to analytics than what they currently had. This meant we were spending time on a project that mattered to our stakeholders.
Next, members of the newsroom told us which metrics mattered the most to them for the Slackbot. This helped prioritize certain functionalities when scoping the project.

Finally, over half of the respondents showed some apprehension regarding the amount of Slack notifications they receive during a work day. This response discouraged us from sending automated reports into public channels. We wanted the bot to be seen as a tool — not another notification to be ignored.

To gain a deeper understanding of the motivations behind creating stories, the next step was to individually meet with 37 Star Tribune newsroom employees. These meetings were with reporters and assigning editors from each of the paper’s four desks — metro, features, business and sports — to talk more about each section’s needs.
In these meetings, we talked about the purpose of analytics in evaluating job performance and how team members interacted with the current analytics tools. They shared their reporting process and what analytics they lacked to do their job more effectively in a digital-first workflow.
Learning about the days of these reporters not only helped prioritize the features in the Slackbot, but it also included those who didn’t traditionally deal with audience analytics in the decision-making process, further building trust and buy-in for the project. These conversations taught us the motivations behind the job of a reporter, or their “why,” in a way we couldn’t gather from survey results. This ensured every functionality we included in the bot supported their mission.
Defining the problem
Through this stakeholder research, we identified three areas where our audience, reporters and editors, needed more information about analytics.
- Easier access to analytics telling the whole story of our desktop and mobile audiences.
- Context on how the results of a specific story performed relative to newsroom averages.
- Increased education on our digital audience and ways they could improve their analytics.
Prioritizing with the MoSCoW framework
Now that we had learned the realm of possibilities for what this bot should include and defined our main problems, it was time to figure out what was the most useful and possible for a minimum viable product.
We used the MoSCoW framework to break down product functions into four areas:
- Must-have: Non-negotiable functionalities that must be included.
- Should-have: Functionalities that are not vital to the project, but would make a big impact.
- Could-have: Functionalities that would make a small impact on the project and are not vital to its initial success.
- Won’t-have: Functionalities that are not required for the success of the project in its chosen time frame.
Data points we included in the must-have section were the number of page views a story received and a story’s traffic sources.
We placed data on subscription generation into the should-have category. It is more complicated to pull from Google Analytics, but makes a big difference in a reporter’s understanding of how they are contributing to the Star Tribune’s business.
Features like graphs showing metric trend lines were placed in the could-have category. They were useful context, but not crucial to create an easily digestible report for the time it would take to code them.
Won’t-have tasks included specific details on how a story was promoted, as there wasn’t an easy way to pull this data from Google Analytics.
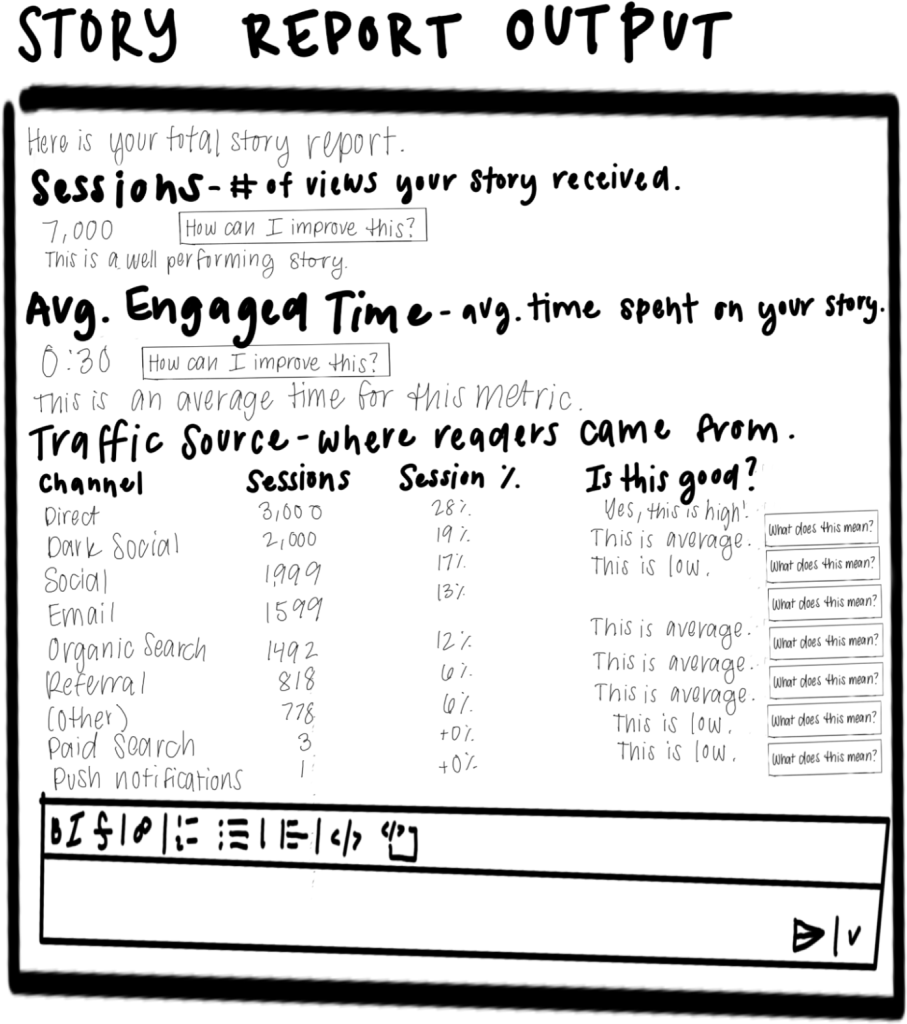
Once these priorities were established, I placed them into a Google Doc and made a rough drawing of the report’s output. This helped us further picture what the final Slackbot would look like.
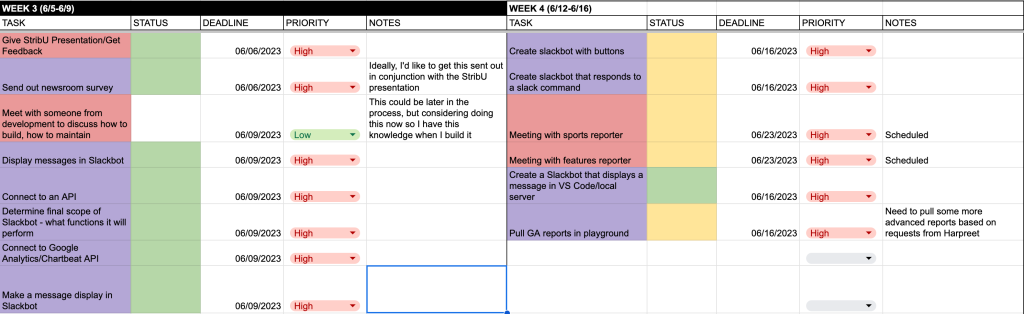
To make sure the project stayed on track, we created a product roadmap on Google Sheets to check the status of important milestones in development throughout the summer.
Writing the code
The Striblytics bot is built in Python using Slack’s Bolt framework. Users input a slash command, “/story” and a unique Article ID at the end of a story’s URL. The bot then pulls data from Google Analytics and Chartbeat’s APIs, parses the responses and sends it back to the user in the form of a message.
The message includes various phrases that give users context on how this particular story compares to newsroom averages. It also includes buttons users can click on to see what a specific metric means or get general tips to raise a metric.
User Testing
After the bot was functional, we tested our prototype with various stakeholders across the newsroom to make sure the user experience made sense. I designed a plan to conduct usability tests to answer four questions that remained about Striblytics.
- Are there any technical issues or bugs that arise when many people use the bot at the same time?
- Does the bot run at an efficient speed?
- Does the process to access and run a report make sense?
- Is the final report design intuitive?
To answer these questions, we tested the bot with 10 newsroom employees, picking reporters and editors who showed interest in getting more access to analytics. Some meetings were conducted in a small group to answer the first question, while others were individual meetings to specifically see how users interacted with the bot.
Users were given a tutorial document that gave background information on how to access the bot and run a report. Then, we asked them to run a report and asked questions about its usefulness for their work.
We grouped the feedback into short-term and long-term features. These short-term goals included adding more context about the average number of sessions per story for our newsroom and condensing the report to make more data visible. See the final version of Striblytics below.
Initial results and measuring success
Since the goal of this project was to give the newsroom more access to analytics to aid in their decision making, we wanted to focus on acquiring users and building their habits. To gather this data, the bot is coded to log data into a spreadsheet every time a report is run.

As of January 2023, there have been 223 reports run on the bot, and over 75% of users have run more than one report.
Next Iterations
Our next work with Striblytics is focused on optimizing its performance and adding more information for the newsroom. We transitioned to creating a BigQuery database to connect to Striblytics, which would include data from GA4, Universal Analytics and Chartbeat.
This improvement allowed us to add more data into the report that is not currently possible within Google’s Analytics Reporting API, such as the headline and percentage of desktop and mobile users. It significantly sped up the time to generate a report.
What we learned
Including stakeholders in every step of the process to understand their decision making process was key to helping the adoption of the tool. It wasn’t enough to dump numbers into an automated Slack message. By taking the time to get to know their goals and making the process collaborative, we were able to make a tool that actually mattered for their jobs and make them feel like they were a part of the process in building it.